Sample equations, code, a figure, and the lesson constructs, used to check how the site renders.
This page is not a lesson. It holds one sample of each kind of content a lesson uses, so that rendering can be checked in every browser engine and by the automated checks of the site.
Equations
Inline: the period of a pendulum of length at small amplitude is .
Display, with a fraction, a root, and Greek letters:
Aligned steps:
An integral, a sum, and a matrix:
Code
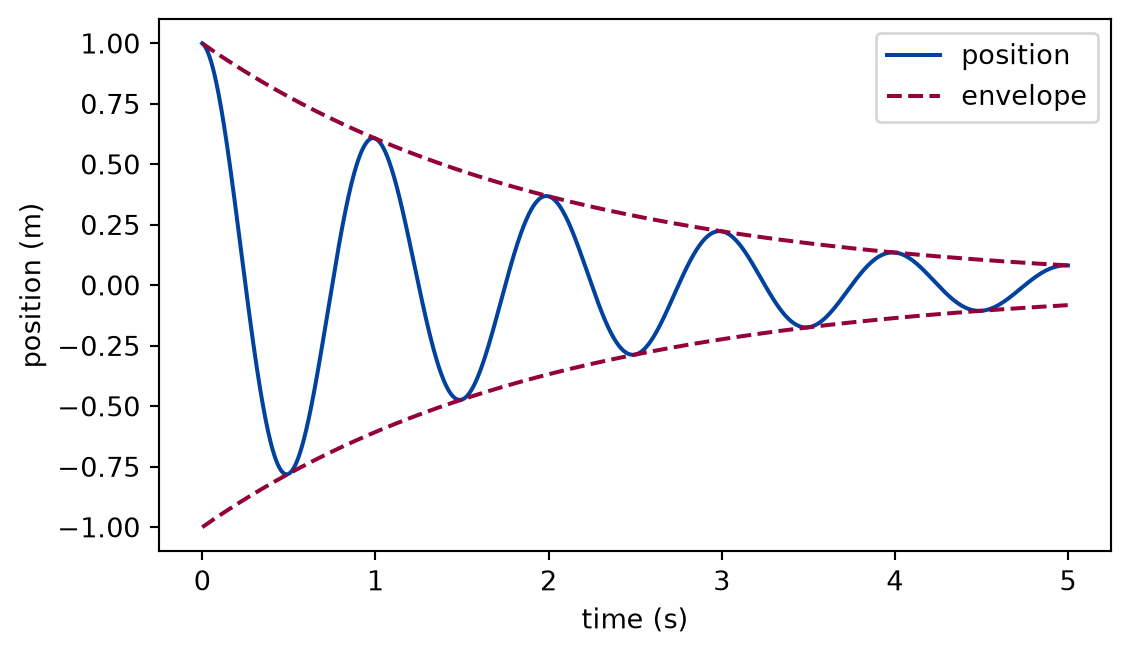
The cell below is executed when the site is built. It imports the function from the pbc package of the repository, so the listing and the output cannot drift apart.
import numpy as npfrom pbc.sample import damped_oscillationt = np.linspace(0.0, 2.0, 5)for time, position inzip(t, damped_oscillation(t), strict=True):print(f"t = {time:.1f} s x = {position:+.4f} m")
t = 0.0 s   x = +1.0000 m
t = 0.5 s   x = -0.7788 m
t = 1.0 s   x = +0.6065 m
t = 1.5 s   x = -0.4724 m
t = 2.0 s   x = +0.3679 m
Figure 1: simulated A damped oscillation and its envelope.
Measured data
The pattern of a measured-data lab (docs/authoring.md, “Measured data”): the data card of the dataset, rendered from its card, and a figure made from the committed sample whose status the build checks against that card.
Data card
Dataset
NPL on-wafer S-parameters of attenuators and loads up to 220 GHz
Source
https://zenodo.org/records/22658069, DOI 10.5281/zenodo.22658069, Liam Ausden, Nick Ridler, Andrej Rumiantsev, Jon Martens, Xiaobang Shang (National Physical Laboratory, MPI Corporation, Anritsu); Zenodo record 22658069, published 2025-09-25 (no version number)
Licence
CC-BY-4.0
Attribution
Creators as above, 'Dataset for the Comparison of Broadband Single-Sweep and Conventional Banded System On-Wafer S-Parameter Measurements up to 220 GHz', Zenodo, doi 10.5281/zenodo.22658069, CC BY 4.0; supports the ARFTG 2025 paper doi 10.1109/ARFTG65332.2025.11168146.
Calibration
Multiline TRL on-wafer calibration, applied by the creators ('_CORR'; readme.txt). The calibration standards and their uncertainty are described in the ARFTG paper, which this spike did not read; the files carry no uncertainty.
Masks
None: no missing values in the four sampled files.
Uncertainty
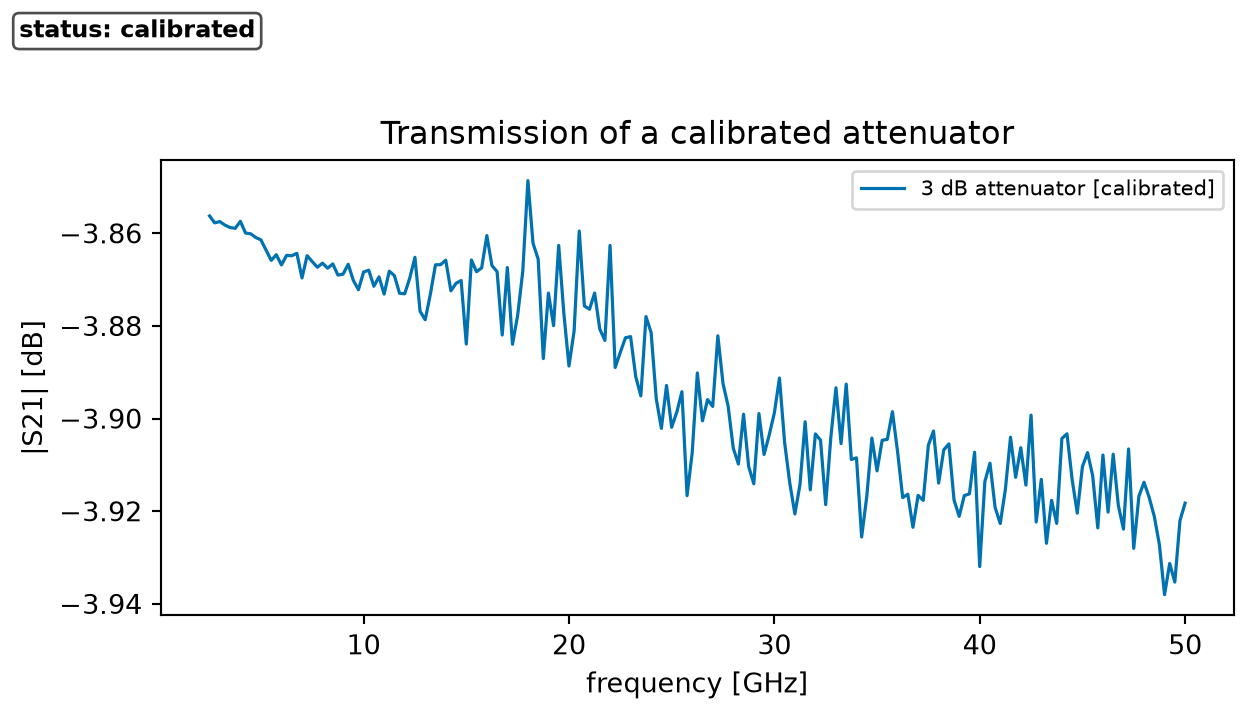
None in the files. The paper compares two instruments; this spike's cross-check shows the 3 dB pad's |S21| differing by at most 0.042 dB between the coaxial and the single-sweep file over 2.5-50 GHz.
Artifacts of the dataset NPL on-wafer S-parameters of attenuators and loads up to 220 GHz and the figure status each gives
Artifact
Type
Figure status
What it is
coaxial_*_CORR.s2p
calibrated-observation
calibrated
Coaxial-system VNA measurement of 3, 6, and 10 dB on-wafer attenuators, 2.5-50 GHz in 250 MHz steps; the '_CORR' files are calibrated with multiline TRL (readme.txt).
broadband_3dB_attenuator_0601_CORR.s2p
calibrated-observation
calibrated
Single-sweep broadband VNA measurement of the 3 dB attenuator, 2.5-220 GHz in 250 MHz steps, multiline-TRL calibrated.
A sample is committed in data/samples/npl-onwafer-sparameters/; the figures on this page are made from it.
The full data: ./scripts/fetch-data.sh npl-onwafer-sparameters downloads it into data/downloads/ and checks its digest. The site build and the checks never download anything.
No-LLM path. Everything on this page, the figures included, is reproduced from the files named here by the code of the page, with no language model and no account. An agent may help you explore the data; what it says is never data.
from pbc.data import SAMPLES_DIRfrom pbc.data.adapters import transmission_seriesfrom pbc.data.plotting import series_with_bandfrom pbc.data.touchstone import read_touchstonenetwork = read_touchstone( SAMPLES_DIR /"npl-onwafer-sparameters"/"coaxial_3dB_attenuator_0601_CORR.s2p")fig, ax = series_with_band(transmission_series(network), "3 dB attenuator", figsize=(6.4, 3.6))ax.set_title("Transmission of a calibrated attenuator")plt.show()
Figure 2: calibrated Transmission of a calibrated 3 dB attenuator against frequency.
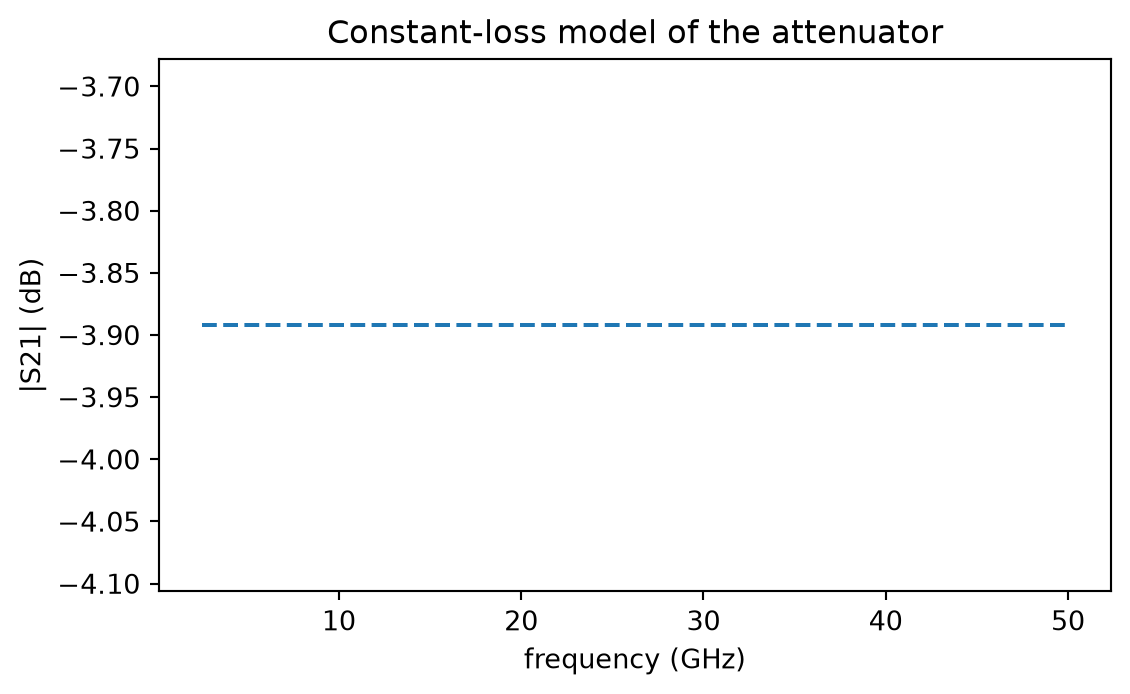
A figure of a model fitted to the dataset shows no data; it is simulated and names the dataset it was fitted to:
import numpy as npmeasured = transmission_series(network)loss =float(np.mean(measured.y))fig, ax = plt.subplots(figsize=(6.4, 3.6))ax.plot(measured.x, np.full_like(measured.x, loss), linestyle="--")ax.set_xlabel(f"{measured.x_name} ({measured.x_unit})")ax.set_ylabel(f"{measured.y_name} ({measured.y_unit})")ax.set_title("Constant-loss model of the attenuator")plt.show()
Figure 3: simulated A constant-loss model fitted to the transmission of the attenuator.
Lesson constructs
These are the constructs of the lesson format, one of each.
A listing included by reference from the package:
def damped_oscillation( t: ArrayLike,*, amplitude: float=1.0, decay_rate: float=0.5, angular_frequency: float=2.0* np.pi,) -> NDArray[np.float64]:"""Return ``amplitude * exp(-decay_rate * t) * cos(angular_frequency * t)``. ``t`` may be a scalar or an array; the result has the shape of ``t``. A negative ``decay_rate`` would describe a growing oscillation and is rejected. """if decay_rate <0:raiseValueError(f"decay_rate must be non-negative, got {decay_rate}") time = np.asarray(t, dtype=np.float64)return amplitude * np.exp(-decay_rate * time) * np.cos(angular_frequency * time)