A thrown ball with drag that grows with the square of its speed has no closed-form motion, so the simulation is validated by its limiting cases and by convergence, and then used to find the range against the launch angle.
With scripts, this page keeps a record in your browser of whether you completed the lesson. Nothing is stored without them.
With scripts, this place suggests what to do next, with the reason, from the progress saved in your browser. Without them, follow the learning path.
A ball thrown through air feels a drag that grows with the square of its speed and always points against its velocity. That couples the horizontal and the vertical motion: how fast the ball slows down horizontally depends on how fast it is falling, and the other way round. The equations of motion cannot be solved in closed form. Everything the previous lessons compared their simulations with is gone.
This lesson is about what to do then. The simulation is checked in the limiting cases that do have exact answers, without drag and in a long fall, and by refinement: a result that keeps changing as the time step shrinks is not a result yet, and the rate at which it stops changing says how far it is from the limit. With the simulation validated, the lesson uses it for a question that has no textbook answer: at what angle should the ball be thrown to go furthest? Without drag the answer is . With drag it is less, and by how much depends on the ball.
Assumptions
The model and the program rest on these assumptions. Each one names what goes wrong when it does not hold.
A point particle without spin. A spinning ball carries a layer of air around with it and feels a sideways force, the Magnus force, that makes topspin dip and backspin float. None of that is in the model; a real throw with spin lands somewhere else.
Quadratic drag with a constant drag coefficient. The drag is with a fixed . This holds in the Newtonian drag regime, where the drag coefficient of a sphere is approximately constant, so that the force scales with the speed squared, and the ball leaves a turbulent wake; the range is of the order of a thousand to a few hundred thousand (not verified), and the first example computes where the tennis ball lies in it. At much lower speeds the law becomes linear, as in the previous lesson. At higher speeds a smooth sphere reaches the drag crisis, where drops abruptly, by more than half (not verified); a rough or seamed ball reaches it earlier. For a ball thrown that fast the constant overestimates the drag. The lesson does not model either end of the range.
Still, uniform air. No wind, and a constant air density. In a wind the drag acts on the velocity relative to the air. Density changes with altitude by a few per cent per hundred metres, which matters for a shell, not for a ball.
Uniform gravity and flat ground at the launch height. The ranges are tens of metres, so the Earth’s curvature and rotation are negligible, and the ball lands at the height it was thrown from. A throw from a height is a one-argument change, shown in the code, but the formula for the drag-free range used as a check assumes a launch from the ground.
A first-order method with a small step. Explicit Euler’s error is proportional to the time step; the convergence study below measures it. The landing point is interpolated linearly within the last step, which adds an error proportional to the square of the step, below the method’s own. As in the previous lesson, a step that is too large makes the method unstable. Near a speed a small change of the speed obeys , which is linear drag with the time constant , so the result of the previous lesson says the step must stay below . The first example puts a number on it, far above every step used.
Round-off is negligible. The steps are far above the resolution of double-precision numbers, so the errors in the tables are the errors of the method.
Drag that grows with the square of the speed
At everyday sizes and speeds a body moving through air leaves a turbulent wake, and the drag on it is
where is the density of the air, the cross-section the body presents to the flow, and a dimensionless drag coefficient that depends on the shape. The constant has the unit kg/m. The force has the magnitude and points against the velocity.
A body falling under this drag reaches the terminal speed at which the drag balances the weight, , so
Go deeper:The Coefficient of Drag (Russell Herman, LibreTexts Mathematics, 3.5.7, on the Stokes drag coefficient and the Newtonian regime; derivation.)
Why the drag is quadratic in the Newtonian drag regime, where the drag coefficient of a sphere is approximately constant, and linear at . The lesson takes the quadratic law as its model and does not need the page.
The terminal speed is the natural scale of the problem. The ratio of the drag to the weight at any moment is . A ball thrown much more slowly than its terminal speed hardly notices the air; a ball thrown at its terminal speed starts with a drag equal to its weight, and its path looks nothing like a parabola.
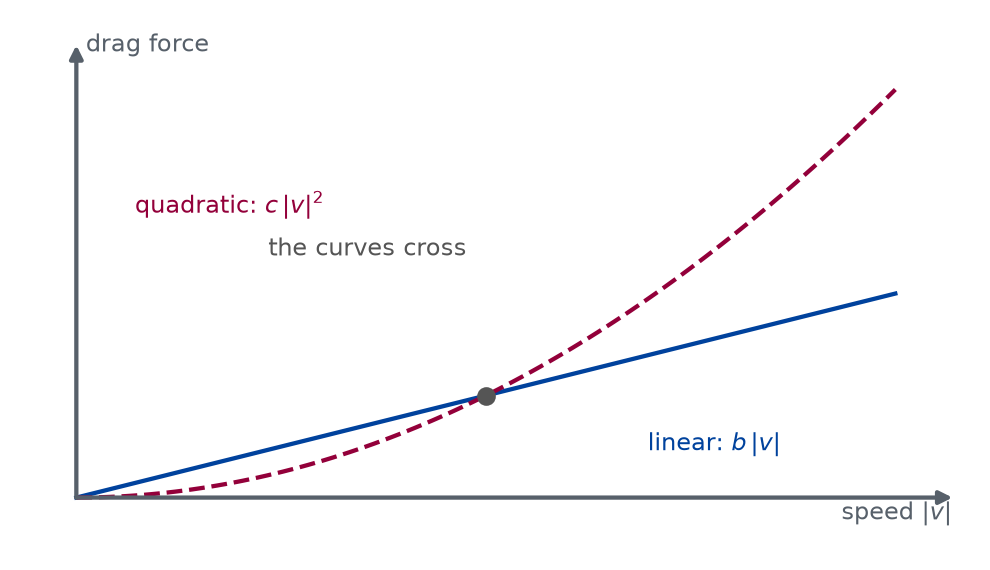
The two laws differ in how fast the drag grows with the speed.
def draw_drag_against_speed() -> Figure:"""The linear and the quadratic drag law against speed, as a sketch.""" fig, ax = canvas(6.4, 3.6, (0, 10), (0, 6)) ax.set_aspect("auto") origin, width, height =0.6, 8.6, 4.6 arrow(ax, (origin, origin), (9.8, origin), colour=PAGE["muted"]) arrow(ax, (origin, origin), (origin, 5.7), colour=PAGE["muted"]) text(ax, (9.8, origin -0.18), r"speed $|v|$", colour=PAGE["muted"], ha="right") text(ax, (origin +0.1, 5.7), "drag force", colour=PAGE["muted"], ha="left") share = np.linspace(0.0, 1.0, 100) ax.plot( origin + width * share, origin + height * share /2, color=FIGURE_COLOURS[0], linewidth=1.6, ) ax.plot( origin + width * share, origin + height * share**2, color=FIGURE_COLOURS[1], linewidth=1.6, linestyle="--", )# The line height * share / 2 and the curve height * share**2 are equal at# share = 1/2, where both are height / 4: the marker is on both. ax.plot( [origin + width /2], [origin + height /4], marker="o", color=FIGURE_COLOURS[2] ) text(ax, (6.6, 1.2), r"linear: $b\,|v|$", colour=0, ha="left") text(ax, (3.2, 3.9), r"quadratic: $c\,|v|^{2}$", colour=1, ha="right") text(ax, (4.7, 3.4), "the curves cross", colour=2, ha="right")return fig
Figure 1: conceptual Drag against speed for the linear and the quadratic law. The quadratic drag is smaller at low speed and larger above the crossing.
The sketch has no scale, and where the curves cross depends on and . It carries the shape: doubling the speed doubles a linear drag and quadruples a quadratic one.
Why there is no closed form
With horizontal and upward, Newton’s second law reads
The square root contains both components, so neither equation can be solved on its own. For linear drag the factor in front of was the constant , the components separated, and each was a first-order linear equation with an exponential solution. Here the factor is the speed itself, which is unknown until the problem is solved. The motion can be reduced to integrals by a change of variables, but those integrals have to be evaluated numerically anyway, and there is no formula to compare a simulation with. This is an argument that the methods of the previous lessons do not apply, not a proof that no formula exists, and the lesson does not prove the latter.
How to trust a simulation without one
Three checks replace the comparison with an exact solution. Together they are the validation strategy of this lesson, and of every later one whose problem has no closed form.
Limiting cases. Set and the motion must become the parabola of the first lesson, with the range for a launch from the ground at speed and angle . The first lesson even predicts how far explicit Euler misses it: the computed height lags the exact one by . At the landing time that lag is , and the ball is falling there with the vertical speed , so it needs a time more to reach the ground: it lands late and so about too far. A simulation that reproduces the parabola with exactly that error is doing what it should. The other limit, a long fall, must approach the terminal speed; the first exercise checks it.
Convergence. Compute the range with the step , then with , , and so on. For a first-order method the differences between successive results must halve each time, and the observed order, of the ratio of successive differences, must tend to one. When it does, the result behaves like , and two steps determine both unknowns. Subtracting from gives , and inserting it back gives This is Richardson extrapolation. The first formula estimates the limit, the second the error of the finer result, both from the simulation alone.
Physical sense. Drag must shorten the range, slow the ball down on the way up, and make the descent steeper than the ascent. These checks catch sign errors that the first two can miss.
Finding the ground
The simulation steps in time, and no step ends exactly at the ground. The loop stops after the first state below it, and the landing point is interpolated linearly between that state and the one before: if the last step went from a height to , the crossing happened a fraction of the way through the step, and the range is the horizontal position at that fraction. Within one step the path is nearly straight. Linear interpolation of a function between two points apart has the error for some in the step, and is largest at the middle of the step, where it is . So the interpolation is off by at most in height, far below the first-order error of the method itself.
The program
The code lives in the modules pbc.mechanics.drag and pbc.mechanics.projectile of the repository and runs on the stepping interface of the previous lesson. The listings in this section are read from those files when the site is built.
The force model and the constant it needs:
def quadratic_drag(c: float) -> Force:"""The quadratic drag force -c |v| v, with the drag constant ``c`` in kg/m. ``c`` is 0 for no drag. For a body of cross-section area A in a fluid of density rho, c = rho C_d A / 2 with the dimensionless drag coefficient C_d of its shape; see ``drag_constant``. """if c <0:raiseValueError(f"the drag constant must not be negative, got {c}")def drag(t: float, x: Vector, v: Vector) -> Vector:return-c * np.sqrt(v @ v) * vreturn drag
def drag_constant(density: float, drag_coefficient: float, area: float) ->float:"""The constant c = rho C_d A / 2 of quadratic drag, in kg/m. ``density`` is that of the fluid in kg/m³, ``drag_coefficient`` the dimensionless C_d of the body's shape, and ``area`` its cross-section facing the flow in m². """return0.5* density * drag_coefficient * area
A throw starts from a speed, an angle, and a height:
def launch(speed: float, angle: float, height: float=0.0) -> State:"""The state at the moment of launch, at time 0. ``speed`` is in m/s, ``angle`` in degrees above the horizontal, and ``height`` the height above the ground in m. """if speed <0:raiseValueError(f"speed must not be negative, got {speed}") radians = np.radians(angle)return State( t=0.0, x=[0.0, height], v=[speed * np.cos(radians), speed * np.sin(radians)], )
A flight is a simulation that stops at the ground, and the landing point is read off the last step:
def fly( initial: State, acceleration: Acceleration, dt: float, step: Stepper = euler_step, max_steps: int=1_000_000,) -> Trajectory:"""Simulate from ``initial`` in steps of ``dt`` (s) until the particle has come down to the ground. The trajectory ends with the first state below the ground (y < 0), so that ``landing`` can interpolate the crossing. Raises ``RuntimeError`` when the particle has not landed after ``max_steps`` steps. """def below_ground(state: State) ->bool:return state.x[1] <0.0 trajectory = simulate(initial, acceleration, dt, max_steps, step, below_ground)if trajectory.x[-1, 1] >=0.0:raiseRuntimeError(f"not landed after {max_steps} steps of {dt} s")return trajectory
def landing(trajectory: Trajectory) -> Landing:"""The landing point of a flight, interpolated linearly between the last state above the ground and the first below it. ``trajectory`` is the result of ``fly``: its last state is the first one below the ground, and the state before it is on or above the ground. """ y = trajectory.x[:, 1]iflen(y) <2or y[-1] >=0.0or y[-2] <0.0:raiseValueError("the trajectory does not end with its first state below the ground;"" simulate the flight with fly()" ) fraction = y[-2] / (y[-2] - y[-1]) # of the last step, until the crossing t = trajectory.t[-2] + fraction * (trajectory.t[-1] - trajectory.t[-2]) x = trajectory.x[-2, 0] + fraction * (trajectory.x[-1, 0] - trajectory.x[-2, 0])return Landing(t=float(t), x=float(x))
The function that puts it all together answers the question of this lesson. It is the one an experiment, or an agent running an experiment, calls:
def projectile_range( speed: float, angle: float, mass: float, drag: float, dt: float,*, height: float=0.0, g: float= STANDARD_GRAVITY, step: Stepper = euler_step,) ->float:"""The horizontal distance in m a projectile travels before it lands. The projectile of ``mass`` (kg) is launched at ``speed`` (m/s) and ``angle`` (degrees above the horizontal) from ``height`` (m) above flat ground, under gravity ``g`` (m/s², downward) and quadratic drag with the constant ``drag`` (kg/m; 0 for no drag). The flight is simulated in time steps of ``dt`` (s) with the stepper ``step``, explicit Euler by default, and the landing point is interpolated within the last step. The result depends on ``dt``: with explicit Euler its error is proportional to ``dt``, so halve ``dt`` until the digits you need stop changing. """ acceleration = newton(mass, weight(mass, [0.0, -g]), quadratic_drag(drag))return landing(fly(launch(speed, angle, height), acceleration, dt, step)).x
def drag_free_range(speed: float, angle: float, g: float= STANDARD_GRAVITY) ->float:"""The exact range in m without drag, for a launch from the ground: v² sin(2 theta) / g, with ``speed`` v in m/s, ``angle`` theta in degrees, and gravity ``g`` in m/s²."""return speed**2* np.sin(np.radians(2.0* angle)) / g
The ball is a tennis ball. Its mass and diameter are set in the cell; the density and viscosity of air at room temperature and the drag coefficient of a sphere in this range of speeds, about 0.5 (not verified), are inputs of the model, not results of it.
mass =0.058# kgdiameter =0.067# mair_density =1.2# kg/m^3air_viscosity =1.8e-5# Pa sdrag_coefficient =0.5c = drag_constant(air_density, drag_coefficient, np.pi * (diameter /2) **2)terminal_speed = np.sqrt(mass * g / c)speed =25.0# launch speed, m/sangle =45.0# launch angle, degreesdt =0.001# time step, sreynolds = air_density * speed * diameter / air_viscositystable_step = mass / (c * speed) # largest stable step at the launch speed, s
The drag constant is = 1.06e-03 kg/m and the terminal speed 23.2 m/s. The ball is thrown at about its terminal speed: the drag over the weight at launch is 1.16. The Reynolds number at launch is 1.1e+05, in the Newtonian drag regime, where a constant drag coefficient is a reasonable model, and the largest stable time step at the launch speed is 2.2 s, far above the time step 0.001 s used here.
The next cell simulates the throw with and without drag and tabulates what a thrower would want to know.
def throws(experiment: Experiment):"""The same throw with and without quadratic drag; record their range, time of flight, and highest point.""" down = [0.0, -g] ball_in_air = newton(mass, weight(mass, down), quadratic_drag(c)) ball_in_vacuum = newton(mass, weight(mass, down)) with_drag = fly(launch(speed, angle), ball_in_air, dt) without_drag = fly(launch(speed, angle), ball_in_vacuum, dt) experiment.table("throws", [ (name, landing(flight).x, landing(flight).t, flight.x[:, 1].max())for name, flight in ( ("with drag", with_drag), ("without drag", without_drag), ) ], columns=[ ("throw", "", ""), ("range", "m", ".2f"), ("time of flight", "s", ".2f"), ("highest point", "m", ".2f"), ], caption="Range, time of flight, and highest point of the same throw ""with and without quadratic drag.", )return with_drag, without_drag
Range, time of flight, and highest point of the same throw with and without quadratic drag.
throw
range (m)
time of flight (s)
highest point (m)
with drag
35.40
3.01
11.22
without drag
63.75
3.61
15.94
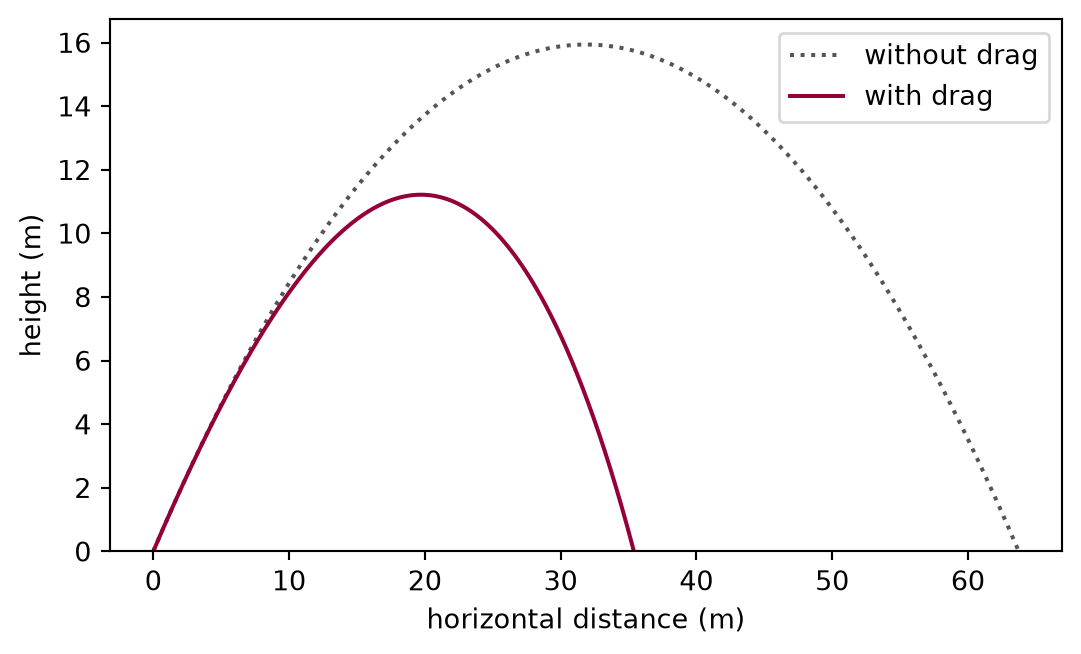
Drag takes away 44 per cent of the range. The exact drag-free range is 63.73 m, and the drag-free simulation is within 2 cm of it; the next example looks at that remaining difference. The paths show where the range goes:
def draw_throw_with_and_without_drag(with_drag, without_drag) -> Figure:"""The paths of the throw with and without drag.""" fig, ax = plt.subplots(figsize=(6.4, 3.6)) ax.plot( without_drag.x[:, 0], without_drag.x[:, 1], color="#555555", linestyle=":", label="without drag", ) ax.plot(with_drag.x[:, 0], with_drag.x[:, 1], color="#93003a", label="with drag") ax.set_ylim(bottom=0.0) ax.set_xlabel("horizontal distance (m)") ax.set_ylabel("height (m)") ax.legend()return fig
Figure 2: simulated Drag removes the symmetry of the path: the ball with drag rises less, peaks early, and comes down steeply, because the drag has taken most of the horizontal velocity by then.
The path with drag is not a parabola. It comes down more steeply than it went up, because the drag has eaten most of the horizontal velocity by then, and it lands at a steeper angle and a lower speed than it was thrown with. The figure shows the shape of the path; the table above gives the numbers, which come from the same simulation.
The drag-free limit
The first check: with the simulated range must approach the exact as the step shrinks, and the first lesson predicts the error to be about , the horizontal velocity times the time step.
def drag_free_convergence(experiment: Experiment):"""The range of the drag-free throw for each time step against the exact range; record the table.""" exact = drag_free_range(speed, angle) v_x = launch(speed, angle).v[0] steps = [0.1/2**k for k inrange(8)] free_ranges = [projectile_range(speed, angle, mass, 0.0, step) for step in steps] experiment.table("drag-free-convergence", [ (step, computed, computed - exact, v_x * step)for step, computed inzip(steps, free_ranges, strict=True) ], columns=[ ("time step", "s", ".6f"), ("range", "m", ".4f"), ("error", "m", ".4f"), ("v_x times time step", "m", ".4f"), ], caption="Range of the drag-free throw for each time step, its error ""against the exact range, and the error the first lesson predicts.", )return exact, v_x, steps, free_ranges
Range of the drag-free throw for each time step, its error against the exact range, and the error the first lesson predicts.
time step (s)
range (m)
error (m)
v_x times time step (m)
0.100000
65.4977
1.7655
1.7678
0.050000
64.6150
0.8828
0.8839
0.025000
64.1737
0.4414
0.4419
0.012500
63.9530
0.2208
0.2210
0.006250
63.8427
0.1105
0.1105
0.003125
63.7875
0.0552
0.0552
0.001563
63.7599
0.0276
0.0276
0.000781
63.7461
0.0138
0.0138
The error halves with the step and matches the prediction from the first lesson to within the small interpolation error: at the smallest step the two differ by 6.2e-07 m. The simulation reproduces the one case that can be solved by hand, including the way it misses it.
Convergence with drag
The second check, on the throw with drag: the range at ever smaller steps, the difference to the previous one, the observed order, and the Richardson estimate of the limit from each pair of steps.
def richardson(experiment: Experiment, steps):"""The range with drag for each time step, the observed order, and the Richardson estimate of the limit; record the table.""" ranges = np.array([projectile_range(speed, angle, mass, c, step) for step in steps]) differences = np.diff(ranges) orders = np.log2(differences[:-1] / differences[1:]) limits =2* ranges[1:] - ranges[:-1] best_estimate = limits[-1] error_estimate =abs(differences[-1]) experiment.table("richardson", [ ( step, ranges[i], differences[i -1] if i elseNone, orders[i -2] if i >=2elseNone, limits[i -1] if i elseNone, )for i, step inenumerate(steps) ], columns=[ ("time step", "s", ".6f"), ("range", "m", ".4f"), ("difference", "m", ".4f"), ("observed order", "", ".3f"), ("estimated limit", "m", ".4f"), ], caption="Range with drag for each time step, the difference to the ""previous result, the observed order, and the Richardson estimate of ""the limit.", )return ranges, differences, orders, best_estimate, error_estimate
Range with drag for each time step, the difference to the previous result, the observed order, and the Richardson estimate of the limit.
time step (s)
range (m)
difference (m)
observed order
estimated limit (m)
0.100000
35.8991
0.050000
35.6545
-0.2446
35.4099
0.025000
35.5278
-0.1267
0.949
35.4011
0.012500
35.4630
-0.0648
0.968
35.3982
0.006250
35.4306
-0.0324
0.998
35.3982
0.003125
35.4143
-0.0163
0.994
35.3980
0.001563
35.4061
-0.0082
0.996
35.3980
0.000781
35.4021
-0.0041
0.999
35.3980
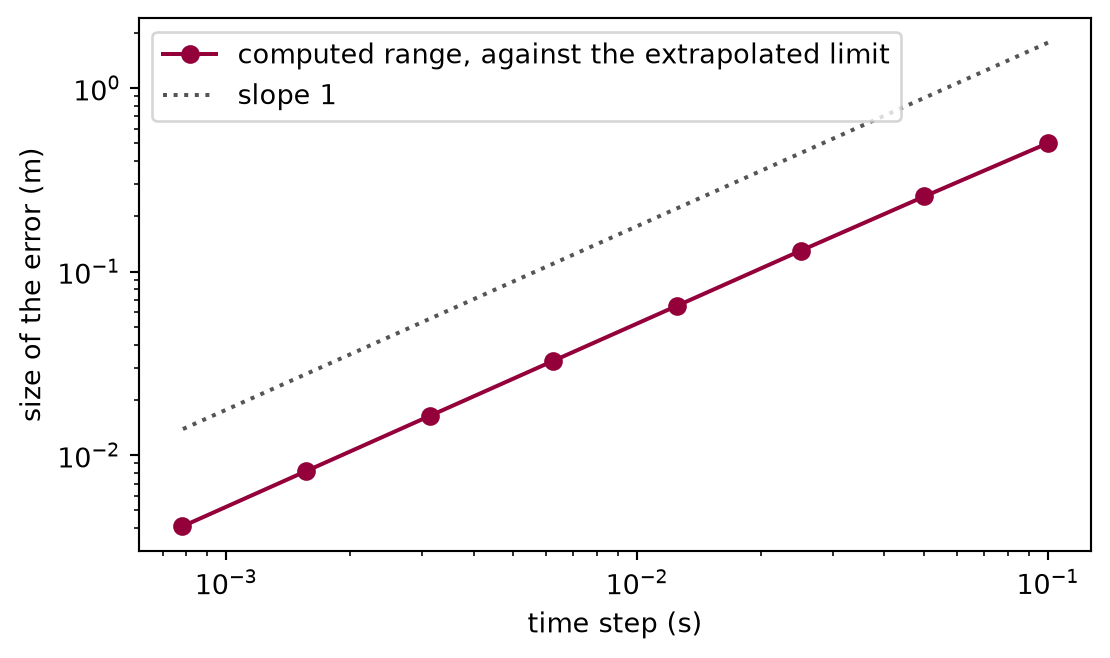
The differences halve and the observed order is 0.999 at the finest step, so the method behaves as a first-order method should on this problem too, and the Richardson estimates settle on a limit long before the direct results do. The range with drag is 35.398 m, and the finest direct result is still 4 mm from the previous one. The Richardson estimate assumes that the error is proportional to the time step; the observed orders are the check of that assumption, not a proof. On logarithmic axes the error of the direct results against the extrapolated limit is a straight line of slope one:
def draw_convergence_of_the_range(steps, ranges, best_estimate, v_x) -> Figure:"""The error of the range with drag against the time step, log-log.""" fig, ax = plt.subplots(figsize=(6.4, 3.6)) ax.loglog( steps, np.abs(ranges - best_estimate), color="#93003a", marker="o", label="computed range, against the extrapolated limit", ) ax.loglog( steps, np.array(steps) * v_x, color="#555555", linestyle=":", label="slope 1", ) ax.set_xlabel("time step (s)") ax.set_ylabel("size of the error (m)") ax.legend()return fig
Figure 3: simulated The error of the range with drag falls in proportion to the time step, parallel to the reference line, so the extrapolated limit is a trustworthy reference.
The range against the launch angle
With the simulation validated and its error known, the question of the lesson. The cell computes the range for launch angles from to , with and without drag, using a step at which the convergence table puts the error well below a decimetre, and then finds the angle of the longest throw to a tenth of a degree with a one-dimensional minimiser from SciPy.
def best_angle(drag, ball_mass=mass):"""The launch angle of the longest throw, to a tenth of a degree.""" result = minimize_scalar(lambda a: -projectile_range(speed, a, ball_mass, drag, scan_dt), bounds=(20.0, 60.0), method="bounded", options={"xatol": 0.05}, )return result.x, -result.fun
def longest_throws(experiment: Experiment):"""The range for each launch angle and the longest throw with and without drag; record the table of the longest throws.""" ranges_with_drag = np.array( [projectile_range(speed, a, mass, c, scan_dt) for a in angles] ) ranges_without = np.array( [projectile_range(speed, a, mass, 0.0, scan_dt) for a in angles] ) best_with, furthest_with = best_angle(c) best_without, furthest_without = best_angle(0.0) experiment.table("longest-throws", [ ("with drag", furthest_with, best_with), ("without drag", furthest_without, best_without), ], columns=[ ("throw", "", ""), ("longest range", "m", ".2f"), ("best angle", "degrees", ".1f"), ], caption="Longest range and the launch angle that gives it, found by a ""one-dimensional minimiser.", )return ranges_with_drag, ranges_without, best_with, best_without
Longest range and the launch angle that gives it, found by a one-dimensional minimiser.
throw
longest range (m)
best angle (degrees)
with drag
35.74
40.5
without drag
63.77
45.0
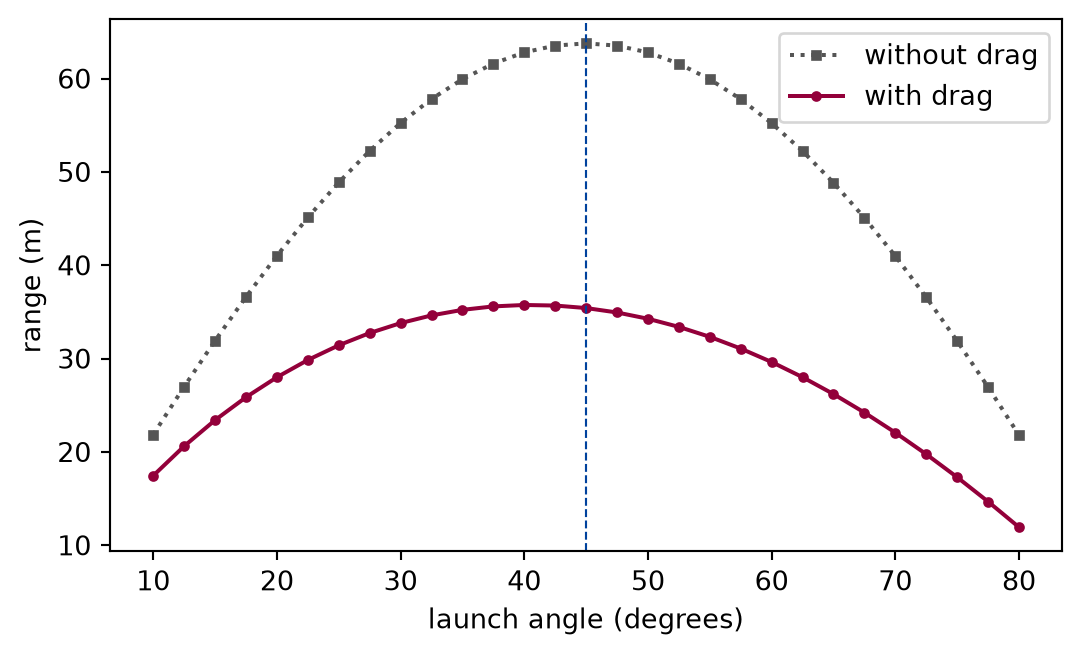
Without drag the longest throw is at , as the formula says, and the simulation finds it to the resolution asked of the minimiser: 45.0 degrees. With drag the best angle is 40.5 degrees, lower. Numerically verified (tennis ball at its launch speed): With quadratic drag the longest throw is flatter than for this ball. The lesson does not derive why. A steeper throw stays in the air longer and so spends more time losing speed to drag, which is the direction of the effect, but a flat throw also climbs less; the size of the shift comes from the simulation, not from this argument.
def draw_range_against_angle(ranges_with_drag, ranges_without) -> Figure:"""The range against the launch angle, with and without drag.""" fig, ax = plt.subplots(figsize=(6.4, 3.6)) ax.plot( angles, ranges_without, color="#555555", linestyle=":", marker="s", markersize=3, label="without drag", ) ax.plot( angles, ranges_with_drag, color="#93003a", marker="o", markersize=3, label="with drag", ) ax.axvline(45.0, color="#00429d", linestyle="--", linewidth=0.8) ax.set_xlabel("launch angle (degrees)") ax.set_ylabel("range (m)") ax.legend()return fig
Figure 4: simulated With drag the range is lower, its peak moves to a flatter angle, and the curve is lopsided: a throw that is too steep costs more than one that is too flat.
The curve with drag is not only lower but lopsided: it falls off more steeply towards high angles. How far the best angle moves below depends on the ratio of the launch speed to the terminal speed, as the third exercise shows.
Limits
The model has a constant drag coefficient, no spin, no wind, and flat ground at the launch height (assumptions one to four). The best angle and the range found here belong to this model of a tennis ball, not to a real throw; the lesson compares the simulation with no measurement.
The Reynolds-number ranges and the drag crisis are order-of-magnitude statements marked as not verified in the lesson, and the one source of the register supports only the form of the two force laws.
The convergence study shows that the error behaves like a first-order error for one throw. The Richardson estimate assumes this; other throws, such as a very steep one, are not checked.
Validation by limiting cases and refinement shows that the program solves its equations, not that the equations describe a ball. Only an experiment could show the second.
Self-check. The simulated range with drag changes by less than a millimetre when the time step is halved once more. Does that show that the range of a real tennis ball thrown like this is known to a millimetre?
Yes. The method has converged, so the range is correct to that precision.
Not quite: convergence shows that the program solves its equations to that precision. The equations have a constant drag coefficient and no spin or wind.
No. It shows that the numerical error of this model is below a millimetre; the model itself is not that accurate.
Correct: convergence measures the error of the method, and the assumptions of the model, such as a constant drag coefficient, are a different and larger source of error.
No. A first-order method cannot reach that precision.
Not quite: a first-order method reaches any precision at enough steps, at a cost that grows in proportion; the second exercise measures it.
Solution to the self-check
The refinement and the Richardson estimate bound the error between the simulation and the exact solution of the model’s equations. They say nothing about the difference between the model and the thrown ball: the drag coefficient is an input of about the right size, and the spin and the wind are absent. The real range is uncertain by far more than a millimetre.
Exercises
Exercise 1.The other limit. Drop the tennis ball from rest from a great height and let it fall for 15 s. Check that its speed approaches the terminal speed derived above, and find the time at which it reaches 95 per cent of it. Use a time step of 1 ms.
Solution to exercise 1
On a vertical line with down positive the acceleration is , and the same functions run it with one-component vectors.
def terminal_fall():"""Exercise 1: the ball dropped from rest, with quadratic drag; the speeds and the time it reaches 95 per cent of the terminal speed.""" dropped = State(t=0.0, x=0.0, v=0.0) falling = newton(mass, weight(mass, [g]), quadratic_drag(c)) fall = simulate(dropped, falling, 0.001, 15_000) speeds = fall.v[:, 0] reached = fall.t[np.argmax(speeds >=0.95* terminal_speed)]return fall, speeds, reached
The terminal speed from the formula is 23.190 m/s; the speed after 15 s of falling is 23.189 m/s, and 95 per cent of the terminal speed is reached after 4.33 s. The speed creeps up to the terminal speed and stays below it, as it must: once the drag balances the weight there is no force left to accelerate the ball. The natural time scale is , the time gravity alone would need to produce the terminal speed; 95 per cent of it is reached after 1.8 of those.
Exercise 2.A step for a millimetre. From the convergence table, which time steps give a computed range with drag that is within 1 cm of the limit, without extrapolation? How small must the step be for 1 mm? Read the first answer from the Richardson error estimates in the table, and find the second by continuing the halving until the estimate drops below 1 mm.
Solution to exercise 2
The error estimate of each result is its difference to the previous one, and the estimates halve with the step, so every extra decimal digit costs a little more than three halvings.
def refine(experiment: Experiment, steps, differences, ranges):"""Exercise 2: the time steps that bring the range within a centimetre, and further halvings until the estimated error is below a millimetre; record the table of the halvings.""" within_a_centimetre = [ stepfor step, error inzip(steps[1:], np.abs(differences), strict=True)if error <0.01 ] tolerance =0.001# m step = steps[-1] previous = ranges[-1] refinement = []whileTrue: step /=2 current = projectile_range(speed, angle, mass, c, step) estimate =abs(current - previous) refinement.append((step, current, estimate))if estimate < tolerance:break previous = current experiment.table("refinement", refinement, columns=[ ("time step", "s", ".6f"), ("range", "m", ".4f"), ("estimated error", "m", ".5f"), ], caption="Further halvings of the time step until the estimated error ""is below the tolerance.", )return within_a_centimetre, step
Further halvings of the time step until the estimated error is below the tolerance.
time step (s)
range (m)
estimated error (m)
0.000391
35.4000
0.00204
0.000195
35.3990
0.00102
0.000098
35.3985
0.00051
The steps of the table with an estimated error below one centimetre are the 2 finest, from 0.001563 s down. A millimetre needs a step of 0.10 ms, that is 30841 steps for one throw. That is still cheap here, but a first-order method pays for every extra digit with ten times the work. The integrators lesson introduces methods that get the same digit for a small fraction of the steps.
Exercise 3.A heavier ball. A steel ball of the same diameter as the tennis ball has a mass of about 1.23 kg, so the same drag constant and a terminal speed several times higher. Thrown at the same 25 m/s, by what fraction does drag shorten its range at 45 degrees, and where is its best angle? Compare with the tennis ball and explain the difference with the ratio of launch speed to terminal speed.
Solution to exercise 3
def steel_and_tennis(experiment: Experiment, best_with):"""Exercise 3: a steel ball of the same size against the tennis ball; record the table.""" steel_mass =1.23# kg steel_terminal_speed = np.sqrt(steel_mass * g / c) steel_range = projectile_range(speed, 45.0, steel_mass, c, scan_dt) steel_best, _ = best_angle(c, steel_mass) tennis_range = projectile_range(speed, 45.0, mass, c, scan_dt) free_range = projectile_range(speed, 45.0, mass, 0.0, scan_dt) experiment.table("steel-and-tennis", [ ("steel", steel_terminal_speed, (speed / steel_terminal_speed) **2, steel_range,100* (1- steel_range / free_range), steel_best, ), ("tennis", terminal_speed, (speed / terminal_speed) **2, tennis_range,100* (1- tennis_range / free_range), best_with, ), ], columns=[ ("ball", "", ""), ("terminal speed", "m/s", ".1f"), ("drag over weight at launch", "", ".3f"), ("range at 45 degrees", "m", ".2f"), ("range lost to drag", "per cent", ".1f"), ("best angle", "degrees", ".1f"), ], caption="The steel ball and the tennis ball, launched at the same speed.", )return steel_terminal_speed, steel_range, tennis_range, free_range
The steel ball and the tennis ball, launched at the same speed.
ball
terminal speed (m/s)
drag over weight at launch
range at 45 degrees (m)
range lost to drag (per cent)
best angle (degrees)
steel
106.8
0.055
61.16
4.1
44.7
tennis
23.2
1.162
35.41
44.5
40.5
For the steel ball the drag at launch is 5 per cent of the weight, so the path is nearly a parabola, the range is shortened by 4.1 per cent, and the best angle is just below . The tennis ball, thrown at its terminal speed, loses 44 per cent of its range, and its best angle moves several degrees down. The one number that matters is , the drag over the weight at launch: it is set by the launch speed and the mass, size, and shape of the ball, and it is why a shot put is thrown as if there were no air while a shuttlecock is not.
The experiment writes every figure of this page into results/, as <label>.png, and every number and table of the page, as the page shows it, into results/results.json. Its numbers match this page to the digits shown, and its figure files are the ones the page shows; digits beyond those can differ between machines, because floating-point libraries differ. Change the code of the experiment and run it again to see what changes.