Fitting a model to observations to find its parameters: how to check a fit against known answers, how to state the uncertainty, how to see that the data cannot tell two parameters apart or that the model is wrong, and what that means for the chirp mass read from the gravitational-wave strain.
With scripts, this page keeps a record in your browser of whether you completed the lesson. Nothing is stored without them.
With scripts, this place suggests what to do next, with the reason, from the progress saved in your browser. Without them, follow the learning path.
The earlier lessons went from parameters to motion: give the mass and the spring constant, get the trajectory. A laboratory goes the other way. It has the trajectory, noisy, and wants the mass and the spring constant. That is an inverse problem, and it is harder than it looks for a reason that no amount of computing removes: a fit always returns numbers. The optimiser converges whether or not the data determine them, whether or not the model is right, and whether or not the stated error is the real one.
The lesson builds the checks one at a time. First a fit is run on synthetic data whose parameters are known, so that the answer can be compared with the truth. Then two ways a fit can converge and mean nothing: parameters that only appear as a combination, and a model that is wrong. Last, the fit of the gravitational-wave lesson is put through the same questions on the measured strain, and the uncertainty it deserves is stated.
Assumptions
The model is a function of the parameters and of the independent variable alone. Everything the observation depends on besides the parameters is fixed in the model. A fit cannot tell a wrong parameter from a wrong fixed value.
The noise is independent, Gaussian, and of known standard deviation. The chi-square, the covariance, and the interval from the profile all rest on it. The residuals are the place to look when it fails, and the measured case below is one where it does.
The uncertainty is small enough for a straight-line picture. The standard errors from the covariance linearise the model at the best fit. The profile of the chi-square does not, and the lesson uses both to see where they differ.
One minimum. The optimiser starts near the truth in the synthetic cases. A real fit can end in another local minimum; the profile walks across the parameter to see this.
A fit is a statement about a model. It says which parameters make the model closest to the data. It does not say that the model is the right one.
From a trajectory to its parameters
A fit is checked against a known answer
A damped oscillation has four parameters. Generate from chosen values, add Gaussian noise of a known standard deviation, and fit. If the procedure is sound, over many noise realisations the estimates scatter around the truth, with a spread equal to the standard error the fit states, and the interval of two standard errors holds the truth in about ninety-five of a hundred of them. Three numbers say it: the bias, the root-mean-square error against the stated standard error, and the coverage.
def recovery(experiment: Experiment):"""The recovery of the four parameters of a damped oscillation from 200 noisy copies; record the table.""" report = recover(damped, t, TRUTH, sigma=SIGMA, trials=200, seed=11, names=NAMES) experiment.table("recovery", [ (name, truth, mean, rms, stated, 100* cover)for name, truth, mean, rms, stated, cover inzip( report.names, report.truth, report.mean, report.rms_error, report.mean_stderr, report.coverage, strict=True, ) ], columns=[ ("parameter", "", "s"), ("truth", "", ".3f"), ("mean estimate", "", ".3f"), ("scatter of the estimates", "", ".4f"), ("stated standard error", "", ".4f"), ("interval holds the truth", "%", ".0f"), ], caption="Recovery of the four parameters of a damped oscillation from 200 ""noisy copies. The scatter is the root-mean-square error of one estimate.", )return report
Recovery of the four parameters of a damped oscillation from 200 noisy copies. The scatter is the root-mean-square error of one estimate.
parameter
truth
mean estimate
scatter of the estimates
stated standard error
interval holds the truth (%)
amplitude
1.000
1.002
0.0209
0.0204
94
decay
0.350
0.351
0.0116
0.0112
93
omega
5.000
5.000
0.0109
0.0107
95
phase
0.400
0.401
0.0201
0.0191
94
Numerically verified (damped oscillation, 120 samples, Gaussian noise of known size, fits started within 20 percent of the truth): Over 200 synthetic data sets the fit recovers every parameter of the damped oscillation with a bias below 0.4% of its value, its stated standard errors are the size of the scatter of the estimates, and its intervals of two standard errors hold the truth in at least 93 percent of the trials. Recovery on synthetic data is a necessary check and not a sufficient one. It shows that the procedure works when the model is right and the noise is as assumed, which is exactly the situation that real data do not guarantee. The next two sections are about the two ways it can fail.
The program
The helpers add three things to fit_curve: a repeated recovery, a profile of the chi-square over one parameter, and a verdict that collects the reasons against a fit. The page shows the profile.
def profile( model: Model, x: Array, y: Array, p0: Sequence[float], name: str, grid: Array,*, sigma: float, names: Sequence[str], bounds: tuple= (-np.inf, np.inf),) -> Profile:"""Chi-square as a function of one parameter, the others refitted at each value. The interval is where the profile is within ``DELTA_CHI2`` of its minimum. When it is not, on one side or on both, the data do not bound the parameter there and the result is marked open. Every refit has to converge. One that does not raises ``ProfileError``: its chi-square is not a minimum over the other parameters, and a profile with such a point could show a bound that the data do not give. """ x = np.asarray(x, dtype=float) y = np.asarray(y, dtype=float) names =list(names) index = names.index(name) grid = np.asarray(grid, dtype=float) others = [k for k inrange(len(names)) if k != index] lower = np.broadcast_to(bounds[0], len(names)) upper = np.broadcast_to(bounds[1], len(names)) values = np.empty(len(grid)) centre =int(np.argmin(np.abs(grid - np.asarray(p0, dtype=float)[index])))# Walk away from the starting value in both directions, each fit starting# from the previous one: a distant start can end in another minimum.for order in (range(centre, len(grid)), range(centre -1, -1, -1)): start = np.asarray(p0, dtype=float)[others]for k in order:def residual(free, fixed=grid[k]): full = np.empty(len(names)) full[index], full[others] = fixed, freereturn (y - model(x, *full)) / sigma fit = optimize.least_squares( residual, start, bounds=(lower[others], upper[others]), x_scale="jac" )# A refit that did not converge gives a chi-square that is not a# minimum, and one such point can open or close the interval.ifnot fit.success:raise ProfileError(f"the refit at {name} = {grid[k]:g} did not converge"f" ({fit.message}); the profile would not be a profile" ) values[k] =float(np.sum(fit.fun**2)) start = fit.x best =int(np.argmin(values)) low, open_low = _edge(grid, values, best, -1) high, open_high = _edge(grid, values, best, +1)return Profile( name, grid, values, float(grid[best]), low, high, open_low, open_high )
A mass on a spring, released from rest, moves as . The spring constant and the mass enter only as the ratio . A fit with both as free parameters has a good fit for every pair on the line : the data constrain one combination, and a single number of the pair is not a result.
def spring_mass(t, k, m):"""Free oscillation of a mass on a spring: only k/m reaches the motion."""return np.cos(np.sqrt(k / m) * t)
def tied_parameters():"""A fit of k and m to the free oscillation, which tells only their ratio, and the profile of k.""" rng = np.random.default_rng(2) y_free = spring_mass(t, K_TRUE, M_TRUE) + rng.normal(0.0, SIGMA, t.size) tied = fit_curve( spring_mass, t, y_free, [4.5, 1.1], sigma=SIGMA, names=["k", "m"], bounds=bound ) profile_k = profile( spring_mass, t, y_free, [K_TRUE, M_TRUE],"k", k_grid, sigma=SIGMA, names=["k", "m"], bounds=bound, )print("reasons against the fit:")for reason in verdict(tied):print(" -", reason)print("profile of k: rise of the chi-square over the whole range ="f" {np.ptp(profile_k.chi2):.2f}" )return tied, profile_k
reasons against the fit:
 - the data do not determine k, m separately (a combination of them is not constrained)
profile of k: rise of the chi-square over the whole range = 0.00
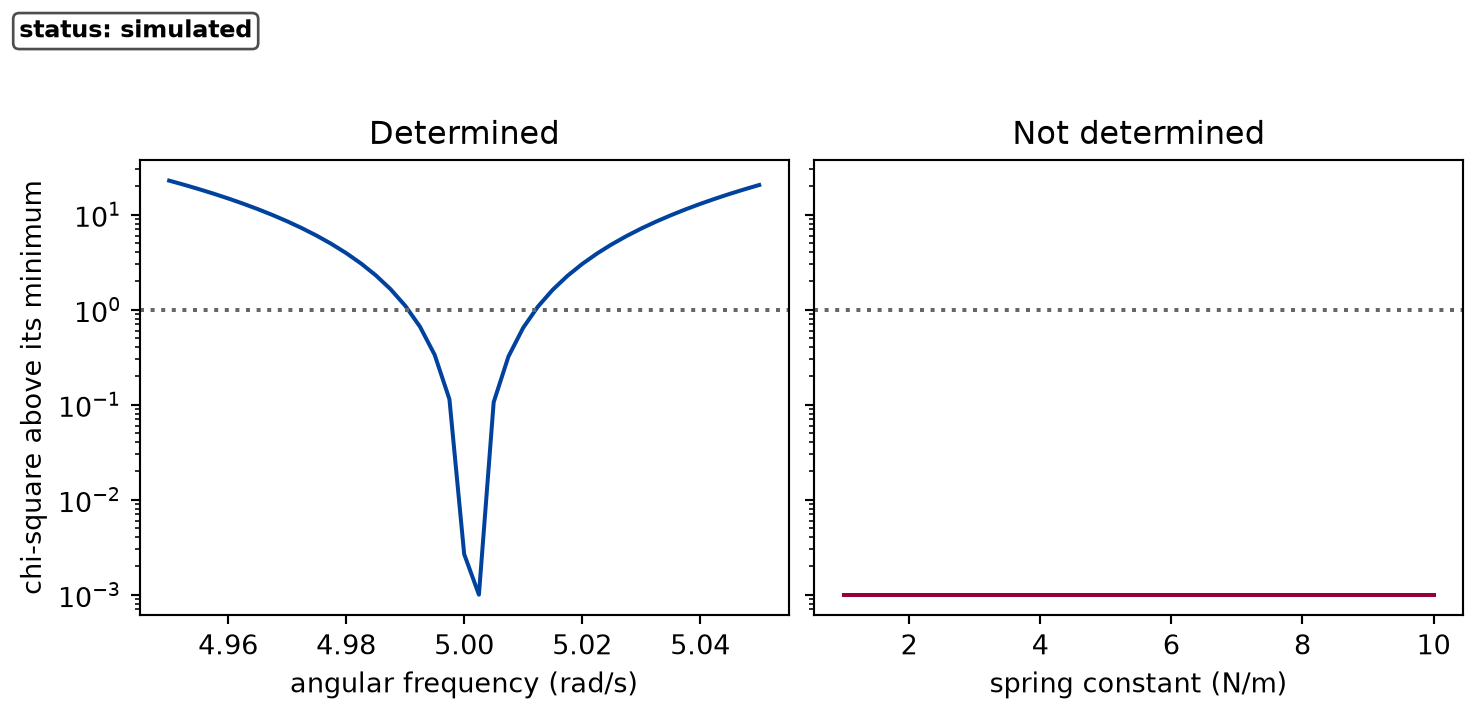
The helper reports it in two ways. The scaled Jacobian of the fit has a singular value of ratio 3e-08 between the smallest and the largest, so a combination of and is not constrained, and the standard errors of both are infinite. The profile says the same without a linear approximation: with refitted at every from 1 to 10, the chi-square never rises by more than 0.00, so the data are as happy with a spring constant of 1 as of 10.
Numerically verified (free oscillation of a mass on a spring, noise of 0.05, 120 samples): A free oscillation fitted with the mass and the spring constant as separate parameters is reported as not identified: the helper flags both parameters, and the profile of the spring constant stays within 0.0 of its minimum over a tenfold range, so no interval for either exists. The remedy is a measurement that depends on the two differently, for example a known force, or the amplitude of a forced oscillation, or a second mass added. It is a change to the experiment, not to the fit.
def frequency_profile():"""A damped oscillation with noise, and the profile of its angular frequency.""" rng = np.random.default_rng(1) y_damped = damped(t, *TRUTH) + rng.normal(0.0, SIGMA, t.size) w_grid = np.linspace(4.95, 5.05, 41) profile_w = profile( damped, t, y_damped, TRUTH, "omega", w_grid, sigma=SIGMA, names=NAMES )return y_damped, profile_w
Figure 1: simulated Chi-square against one parameter, the others refitted at each value, relative to the minimum. The angular frequency of the damped oscillation has a narrow bowl; the spring constant of the free oscillation, where the mass can compensate, has a flat profile with no interval. The dotted line marks one above the minimum.
The left panel is the contrast: a parameter that the data bound, with an interval from 4.991 to 5.012 radians per second at one above the minimum.
A model that is wrong
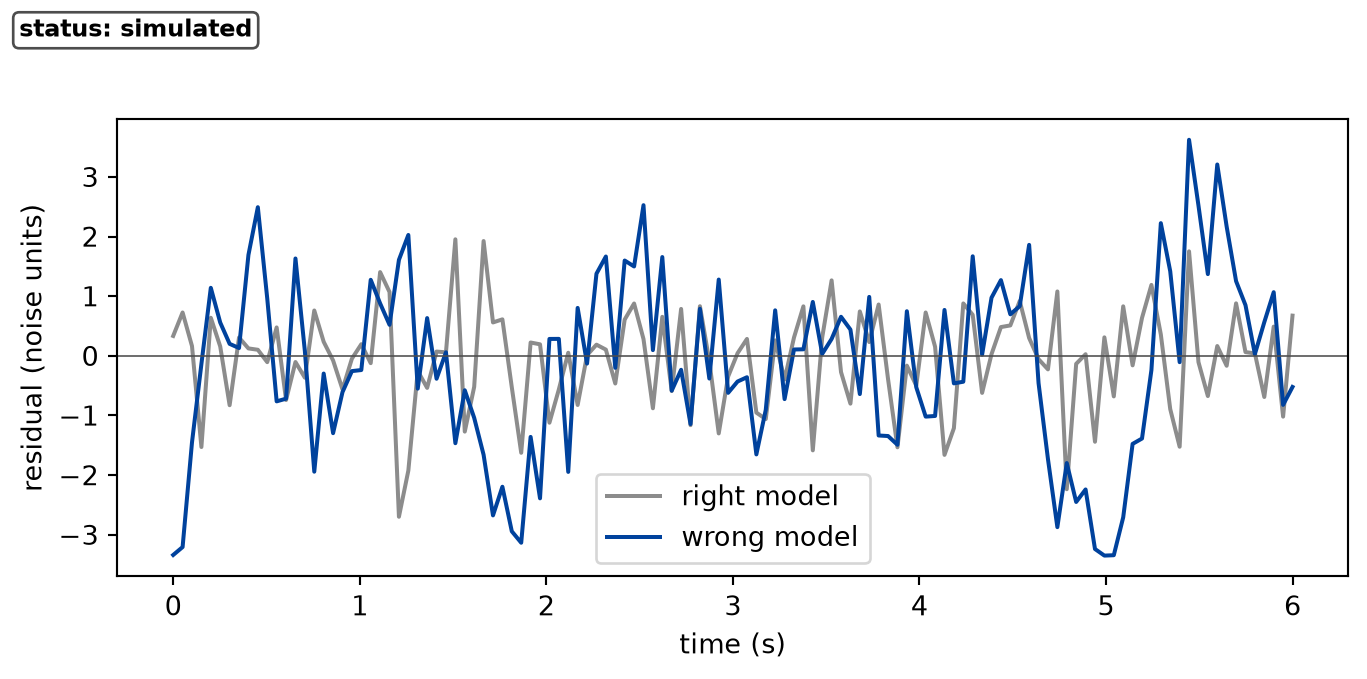
The second failure is quieter. Suppose the true damping is of dry friction, a loss that falls linearly with time, and the fit uses the exponential decay of the viscous model. The optimiser converges, the parameters have small standard errors, and the curve passes through the points to the eye. The residuals say otherwise.
def wrong_model(y_damped):"""The damped model fitted to a linear loss and to its own data.""" envelope = np.clip(1.0- t /5.0, 0.0, None) # linear loss: dry friction rng = np.random.default_rng(5) y_dry = envelope * np.cos(5.0* t +0.4) + rng.normal(0.0, SIGMA, t.size) wrong = fit_curve(damped, t, y_dry, TRUTH, sigma=SIGMA, names=NAMES) right_fit = fit_curve(damped, t, y_damped, TRUTH, sigma=SIGMA, names=NAMES)print("wrong model, reasons against:")for reason in verdict(wrong):print(" -", reason)print("right model, reasons against:", verdict(right_fit) or"none")return wrong, right_fit
wrong model, reasons against:
 - the residuals are correlated (lag-1 autocorrelation 0.61, 7 standard deviations from independent noise): the model leaves structure, or the noise is not independent
right model, reasons against: none
The fit of the wrong model has a reduced chi-square of 2.4 against 0.7 for the right one, and the lag-one autocorrelation of its residuals is far outside what independent noise gives. Both are consequences of one thing: the residuals still hold a smooth signal. The size of the standard errors says nothing here, because they are the errors of the parameters if the model is right.
def draw_residuals(wrong, right_fit) -> Figure:"""The residuals of the right and of the wrong model.""" fig, ax = plt.subplots(figsize=(7.0, 3.4), constrained_layout=True) ax.plot(t, right_fit.residuals / SIGMA, color="0.55", label="right model") ax.plot(t, wrong.residuals / SIGMA, color=FIGURE_COLOURS[0], label="wrong model") ax.axhline(0.0, color="0.3", lw=0.6) ax.set_xlabel("time (s)") ax.set_ylabel("residual (noise units)") ax.legend() label_status(fig, "simulated")return fig
Figure 2: simulated Residuals of two fits of the same kind of data, in units of the noise. With the right model (grey) they scatter about zero. With the exponential decay fitted to a linear loss (coloured) they swing in a slow pattern, which independent noise does not.
Numerically verified (one seeded data set of each kind, noise of 0.05, 120 samples): A fit of the exponentially damped oscillation to data with a linear loss converges with small standard errors and a reduced chi-square of 2.4, and the verdict of the helper lists structure in its residuals; the same fit to data of the right model lists none. A fit is evidence for a model only when it is a good fit and nothing is left in the residuals and the data determine the parameters. Each of the three can fail alone.
The measured case: the chirp mass of GW150914
The gravitational-wave lesson fitted the Newtonian chirp to the whitened strain and reported a chirp mass. The same three questions apply, and a new one that only a known signal can answer: how far is the estimate from the truth on this noise? The measured strain has no known truth, so the truth is made. A chirp of known chirp mass, the size of the fitted signal, is added to stretches of the file where no event is, and the same fit is run on each.
The reasons against taking this fit as evidence, from the same helper: the data do not determine chirp mass separately (a combination of them is not constrained); the residuals are correlated (lag-1 autocorrelation 0.95, 38 standard deviations from independent noise): the model leaves structure, or the noise is not independent. The fit gives a chirp mass of 41.0 solar masses with a profile interval of 40.8 to 42.0, and a reduced chi-square of 0.85.
Both reasons deserve a reading. The first is the tie of the chirp mass with the coalescence time that the gravitational-wave lesson described: the interval of the profile, and not the standard error of the covariance, is the statement about the mass. The second is a property of the processing before it is a property of the model. The whitened strain was band-passed, which makes neighbouring samples alike even for noise alone. The next cell measures that on a stretch of the whitened strain with no event, and then runs the injection.
def noise_correlation(gw_time, gw_data):"""The correlation of neighbouring samples of the whitened noise.""" quiet = (np.abs(gw_time) >0.3) & (np.abs(gw_time) <0.65)return residual_autocorrelation(gw_data["H1"][quiet])[0]
The lag-one autocorrelation of the whitened Hanford noise away from the event is 0.95, close to that of the residuals, so the helper’s second reason is in large part the band-pass and not a missing piece of the model. It does mean that the samples are not independent, which the stated interval assumes.
TRUTH_MC, TRUTH_TC =35.0, 0.03CENTRES = [-12.0, -8.0, 8.0, 12.0] # seconds from the event: no event there
def injection(experiment: Experiment, gw_strains, gw_delays, gw_peak):"""A known chirp added to four stretches of strain without an event and fitted; record the table.""" injections = inject_and_fit( gw_strains, CENTRES, truth_mc=TRUTH_MC, truth_tc=TRUTH_TC, delays=gw_delays, peak=gw_peak, band=BAND, window=WINDOW, mc_grid=np.arange(24.0, 48.0, 1.0), ) inj_mc = np.array([inj.mc for inj in injections]) inj_half =float(np.mean([(inj.high - inj.low) /2for inj in injections])) inj_rms =float(np.sqrt(np.mean((inj_mc - TRUTH_MC) **2))) inj_worst =float(np.max(np.abs(inj_mc - TRUTH_MC))) inj_covered =sum(inj.covers(TRUTH_MC) for inj in injections) experiment.table("injection", [ ( inj.centre, inj.mc, inj.low, inj.high,"yes"if inj.covers(TRUTH_MC) else"no", )for inj in injections ], columns=[ ("noise taken around", "s from the event", ".0f"), ("recovered chirp mass", "solar masses", ".1f"), ("stated interval, low", "solar masses", ".1f"), ("stated interval, high", "solar masses", ".1f"), ("holds the truth", "", "s"), ], caption=f"A chirp of {TRUTH_MC:g} solar masses, of the size of the fitted ""signal, added to four stretches of strain without an event.", )returnlen(injections), inj_half, inj_rms, inj_worst, inj_covered
A chirp of 35 solar masses, of the size of the fitted signal, added to four stretches of strain without an event.
noise taken around (s from the event)
recovered chirp mass (solar masses)
stated interval, low (solar masses)
stated interval, high (solar masses)
holds the truth
-12
35.1
34.9
35.4
yes
-8
35.0
34.7
35.1
yes
8
36.0
35.8
36.1
no
12
35.0
35.0
35.1
yes
The injected chirp is recovered: the estimates lie within 1.0 solar masses of the truth. But the stated intervals, 0.2 solar masses wide on average on each side, hold the truth in only 3 of 4 stretches, while the root-mean-square error of the estimates is 0.5 solar masses. The interval of the profile assumes independent noise, which the real noise is not, and here it is too small. The scatter of the injections points more directly at the uncertainty due to the noise, but four stretches are a demonstration and not an estimate: they show that the interval is too small, not how large it should be.
def band_spread(gw_strains, gw_delays, gw_seg, gw_time, gw_fit):"""The chirp mass for three bands of the fit.""" gw_bands = [(35.0, 350.0), (35.0, 250.0), (30.0, 300.0)] gw_band_mc = []for band in gw_bands:if band == BAND: gw_band_mc.append(gw_fit.mc)continue whiten = { det: make_whitener(gw_strains[det], gw_seg[det], band) for det in gw_strains } gw_series = {det: whiten[det](gw_seg[det].strain) for det in gw_strains} other = fit_chirp( gw_time, gw_series, whiten, gw_delays, window=WINDOW, sigma=noise_sigma(gw_series["H1"], gw_time, (0.3, 0.65)), mc_grid=np.arange(26.0, 48.0, 2.0), ) gw_band_mc.append(other.mc)returnmin(gw_band_mc), max(gw_band_mc)
The noise is one source of uncertainty, and the choice of analysis is another. Repeating the fit with three bands, as the earlier lesson did, gives chirp masses from 38 to 41 solar masses.
Experimentally supported (Newtonian-order chirp, window of 0.2 s before the event time, four off-source stretches, three bands, noise estimated from the file): The fit of the Newtonian chirp to the measured strain gives a detector-frame chirp mass of 41 solar masses with a profile interval of 0.6 on each side. A known chirp of 35 solar masses added to four stretches of strain without an event is recovered with a root-mean-square error of 0.5 solar masses where the stated intervals averaged 0.2, and the choice of band moves the fitted value between 38 and 41; the estimate is 10 solar masses above the published detector-frame value of 31. The uncertainty to quote for the measured value is therefore not the interval of the profile. It is at least the scatter that the injections show, and the spread over the analysis is larger still; neither contains the error of the model, which the earlier lesson lists among the possible reasons for the distance to the published value and which this lesson does not measure.
What the fit cannot say
The fit has two parameters, the chirp mass and the coalescence time, and the singular ratio of 1.6e-05 of the helper shows how close to tied they are. A different identifiability limit sits in the model itself. At leading order the chirp depends on the masses only through , so every pair of masses with that chirp mass fits equally well:
def degenerate_masses(experiment: Experiment, gw_fit) ->None:"""Pairs of masses with the chirp mass of the fit; record the table.""" mass_rows = []for q in (1.0, 0.8, 0.5, 0.25):# m1 + m2 from the chirp mass at a given ratio q = m2 / m1. total_mass = gw_fit.mc * (1+ q) ** (6/5) / q ** (3/5) heavier = total_mass / (1+ q) mass_rows.append( (q, heavier, q * heavier, float(chirp.chirp_mass(heavier, q * heavier))) ) experiment.table("degenerate-masses", mass_rows, columns=[ ("mass ratio", "", ".2f"), ("heavier mass", "solar masses", ".0f"), ("lighter mass", "solar masses", ".0f"), ("chirp mass", "solar masses", ".1f"), ], caption="Pairs of masses with the chirp mass of the fit: the leading-order ""chirp is the same for all of them.", )
Pairs of masses with the chirp mass of the fit: the leading-order chirp is the same for all of them.
mass ratio
heavier mass (solar masses)
lighter mass (solar masses)
chirp mass (solar masses)
1.00
47
47
41.0
0.80
53
42
41.0
0.50
67
34
41.0
0.25
99
25
41.0
The four pairs differ in the heavier mass by a large factor and give the same chirp, so the data of this model constrain no individual mass. A statement of the two masses from this fit would be an answer to a question the model cannot ask, exactly like the spring constant above.
Limits
Synthetic recovery is a test of the procedure. It shows that the fit works when its assumptions hold. The injection of the last section is closer to the real case because the noise is real, but the injected signal is the model itself, so it cannot show an error of the model.
The standard errors and the profile assume the noise is white. The injection shows by how much they fail in the measured case; four stretches give the scatter only roughly, and a different seed or more stretches would change the number.
The verdict is a screen. It looks for the three failures of the lesson. A residual structure of the size of the noise, a model that is wrong in a way the data cannot show, or an identifiable parameter that is simply biased, pass it.
The sloppy-direction threshold is a convention. The helper calls a combination undetermined below a singular ratio of . A ratio of is a weakly determined parameter with a large error bar, and nothing in the helper says where the border is for a given purpose.
The measured case is one event and one model. The comparison with the published value is a statement about this method on this record, not a test of the theory.
No agent is part of this lesson. The roadmap allows an agent that proposes fits; it is not built here, and the helpers do not depend on one.
In plain words: a fit hands back numbers whatever the data hold. Run it first on data whose answer you know, ask whether the data can separate the parameters, look at what the residuals still contain, and quote the uncertainty that the known-signal test shows rather than the one the optimiser prints.
Self-check. A fit of with and both free returns small standard errors for and a perfect-looking curve. What should you report for and , and what would make them separately measurable?
With scripts, you can record in this browser that you answered this question.
Solution to the self-check
Nothing for and separately: they appear only as the product , so the helper flags both as not identified and their profiles are flat. Report the product with its error. They become measurable if another observation depends on them differently, for instance a second quantity that contains alone.
Exercises
Exercise 1.A record that is too short. Run recover on the damped oscillation with the times np.linspace(0, 0.8, 30) and sigma=0.2, so that the record covers less than a decay time. Which parameter is determined worst compared with its own size, and do the stated errors still follow the scatter?
Hint 1 of 1 for exercise 1
Divide the rms_error of each parameter by its truth, and compare rms_error with mean_stderr.
Solution to exercise 1
def short_record(experiment: Experiment) ->None:"""Exercise 1: fits of a record shorter than one decay time; record the table.""" t_short = np.linspace(0.0, 0.8, 30) short = recover(damped, t_short, TRUTH, sigma=0.2, trials=100, seed=4, names=NAMES) rows = [ (label, rms / value, stated, rms, 100* cover)for label, value, cover, rms, stated inzip( short.names, short.truth, short.coverage, short.rms_error, short.mean_stderr, strict=True, ) ] experiment.table("short-record", rows, columns=[ ("parameter", "", "s"), ("scatter over value", "", ".2f"), ("stated error", "", ".3f"), ("scatter", "", ".3f"), ("coverage", "%", ".0f"), ], caption="Fits of a record shorter than one decay time: the stated error ""against the scatter of 100 trials.", )
Fits of a record shorter than one decay time: the stated error against the scatter of 100 trials.
parameter
scatter over value
stated error
scatter
coverage (%)
amplitude
0.16
0.168
0.157
95
decay
0.99
0.371
0.345
97
omega
0.07
0.374
0.356
94
phase
0.36
0.143
0.142
95
The decay is the worst: in a record shorter than one decay time the amplitude barely falls, so the rate has a scatter as large as its value. The stated errors still follow the scatter, which is why a wide stated error is honest here, and why a result with a standard error as large as the value is not a measurement.
Exercise 2.A second mass. Add a second parameter set to the spring: a known extra mass of 0.5 added to the moving mass in a second run, with the same spring. Fit both runs together for and and show that they are now determined.
Hint 1 of 1 for exercise 2
The combined model concatenates the two runs; each has its own . Use fit_curve on the concatenated times and look at identifiable.
Solution to exercise 2
def two_runs(index, k, m): first = np.cos(np.sqrt(k / m) * t) second = np.cos(np.sqrt(k / (m +0.5)) * t)return np.where( index < t.size, first[np.minimum(index, t.size -1).astype(int)], second[np.maximum(index - t.size, 0).astype(int)], )
def joint_fit():"""Exercise 2: k and m from two runs, the second with a known extra mass.""" index = np.arange(2* t.size, dtype=float) rng = np.random.default_rng(8) y_two = two_runs(index, K_TRUE, M_TRUE) + rng.normal(0.0, SIGMA, index.size) joint = fit_curve( two_runs, index, y_two, [4.5, 1.1], sigma=SIGMA, names=["k", "m"], bounds=bound )print("identifiable:", joint.identifiable)print(f"k = {joint.value('k'):.2f} +/- {joint.stderr[0]:.2f},"f" m = {joint.value('m'):.2f} +/- {joint.stderr[1]:.2f}" )
The experiment writes every figure of this page into results/, as <label>.png, and every number and table of the page, as the page shows it, into results/results.json. Its numbers match this page to the digits shown, and its figure files are the ones the page shows; digits beyond those can differ between machines, because floating-point libraries differ. Change the code of the experiment and run it again to see what changes.